Every woman deserves to be safe. But one in three women still experience violence in the EU.
#SafeSpaces
Gender-based violence remains invisible to authorities
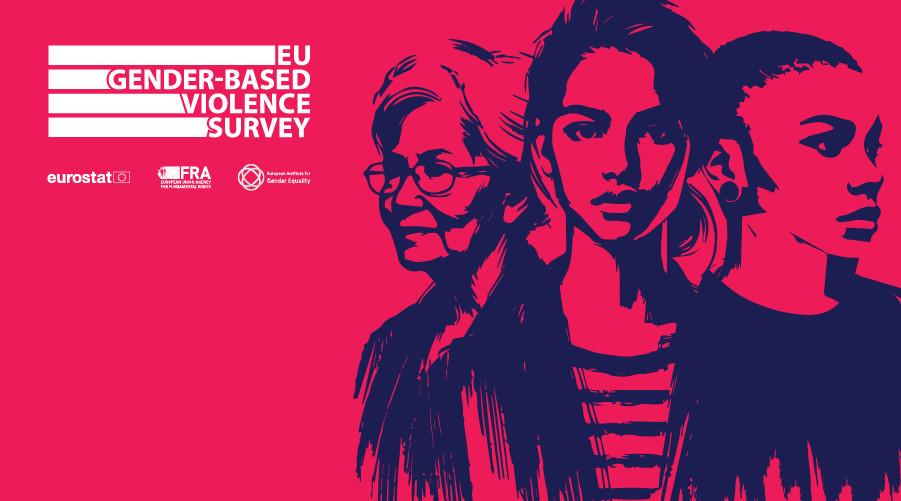
The EU gender-based violence survey shows the shocking levels of violence against women. It also shows that too much violence goes unreported. We need more prevention and protection measures because every woman deserves to be and to feel safe - everywhere.
Women in the EU experience violence in all areas of life
Five shocking findings from the biggest-ever EU gender-based violence survey which drew on responses from almost 115,000 women across the EU.
-
1 in 3 women in the EU experienced physical or sexual violence in their lifetime.
-
1 in 8 women experienced sexual violence, including rape, by someone other than their partner.
-
1 in 5 women face physical or sexual violence from their partner, a relative or another member of their household.
-
1 in 3 women were sexually harassed at work.
2 in 5 young women experience sexual harassment at their workplace.
-
Just over 1 in 8 women who experienced violence reported the incident to the police.
1 in 5 contacted a doctor or social services, and slightly more than 1 in 20 a helpline or victim support service.
Mapping violence against women
Explore our interactive heatmaps to see how the prevalence of various forms of violence varies among the EU Member States.
- Women who have experienced physical violence or threats and/or sexual violence by any perpetrator in their lifetime
- Women who have experienced physical violence or threats and/or sexual violence by an intimate partner in their lifetime
- Women who have experienced physical violence or threats, sexual violence and/or psychological violence by an intimate partner in their lifetime
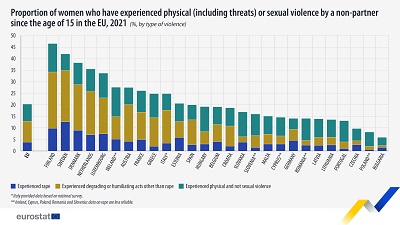
- Women who have experienced physical violence or threats and/or sexual violence by someone other than their intimate partner, since the age of 15
- Women who have experienced sexual harassment at work in their lifetime

| Member State | Percentage of WOMEN WHO HAVE EXPERIENCED PHYSICAL VIOLENCE OR THREATS AND/OR SEXUAL VIOLENCE BY ANY PERPETRATOR IN THEIR LIFETIME |
|---|---|
| Belgium | 29.1 |
| Bulgaria | 11.9 |
| Czechia | 19.7 |
| Denmark | 47.5 |
| Germany | 25.6 |
| Estonia | 33.1 |
| Ireland | 40.7 |
| Greece | 36.5 |
| Spain | 28.2 |
| France | 34.5 |
| Croatia | 25.3 |
| Italy | 31.7 |
| Cyprus | 36.1 |
| Latvia | 25.1 |
| Lithuania | 25.2 |
| Luxembourg | 45.4 |
| Hungary | 49.1 |
| Malta | 24.4 |
| Netherlands | 41.2 |
| Austria | 35.7 |
| Poland | 16.7 |
| Portugal | 19.7 |
| Romania | 42.2 |
| Slovenia | 22.5 |
| Slovakia | 37.9 |
| Finland | 57.1 |
| Sweden | 52.5 |
| EU-27 | 30.7 |

| Member State | Percentage of WOMEN WHO HAVE EXPERIENCED PHYSICAL VIOLENCE OR THREATS, SEXUAL VIOLENCE AND/OR PSYCHOLOGICAL VIOLENCE BY AN INTIMATE PARTNER IN THEIR LIFETIME |
|---|---|
| Belgium | 17.1 |
| Bulgaria | 9.3 |
| Czechia | 13.4 |
| Denmark | 25.7 |
| Germany | 15.8 |
| Estonia | 21.8 |
| Ireland | 22.7 |
| Greece | 21.7 |
| Spain | 14.4 |
| France | 17.7 |
| Croatia | 12.7 |
| Italy | 13.6 |
| Cyprus | 30.0 |
| Latvia | 16.1 |
| Lithuania | 16.6 |
| Luxembourg | 26.6 |
| Hungary | 41.1 |
| Malta | 14.6 |
| Netherlands | 16.7 |
| Austria | 17.1 |
| Poland | 11.2 |
| Portugal | 10.3 |
| Romania | 37.0 |
| Slovenia | 13.4 |
| Slovakia | 30.7 |
| Finland | 33.8 |
| Sweden | 31.0 |
| EU-27 | 17.7 |

| Member State | Percentage of WOMEN WHO HAVE EXPERIENCED PHYSICAL VIOLENCE OR THREATS, SEXUAL VIOLENCE AND/OR PSYCHOLOGICAL VIOLENCE BY AN INTIMATE PARTNER IN THEIR LIFETIME |
|---|---|
| Belgium | 31.3 |
| Bulgaria | 20.5 |
| Czechia | 33.5 |
| Denmark | 45.0 |
| Germany | 31.9 |
| Estonia | 41.2 |
| Ireland | 35.0 |
| Greece | 41.8 |
| Spain | 28.6 |
| France | 30.2 |
| Croatia | 28.1 |
| Italy | 25.9 |
| Cyprus | 44.5 |
| Latvia | 30.1 |
| Lithuania | 30.7 |
| Luxembourg | 47.4 |
| Hungary | 54.6 |
| Malta | 26.0 |
| Netherlands | 33.4 |
| Austria | 37.8 |
| Poland | 19.6 |
| Portugal | 22.5 |
| Romania | 48.9 |
| Slovenia | 27.9 |
| Slovakia | 50.8 |
| Finland | 52.6 |
| Sweden | 48.2 |
| EU-27 | 31.8 |

| Member State | Percentage of WOMEN WHO HAVE EXPERIENCED PHYSICAL VIOLENCE OR THREATS AND/OR SEXUAL VIOLENCE BY SOMEONE OTHER THAN THEIR INTIMATE PARTNER, SINCE THE AGE OF 15 |
|---|---|
| Belgium | 19.1 |
| Bulgaria | 5.9 |
| Czechia | 9.7 |
| Denmark | 38.2 |
| Germany | 14.1 |
| Estonia | 20.6 |
| Ireland | 27.6 |
| Greece | 24.8 |
| Spain | 20.0 |
| France | 26.1 |
| Croatia | 18.7 |
| Italy | 24.8 |
| Cyprus | 14.6 |
| Latvia | 13.9 |
| Lithuania | 13.6 |
| Luxembourg | 33.7 |
| Hungary | 19.2 |
| Malta | 15.1 |
| Netherlands | 35.5 |
| Austria | 27.5 |
| Poland | 8.2 |
| Portugal | 13.1 |
| Romania | 14.1 |
| Slovenia | 16.0 |
| Slovakia | 16.9 |
| Finland | 46.5 |
| Sweden | 42.0 |
| EU-27 | 20.2 |

| Member State | Percentage of WOMEN WHO HAVE EXPERIENCED SEXUAL HARASSMENT AT WORK |
|---|---|
| Belgium | 32.9 |
| Bulgaria | 12.2 |
| Czechia | 30.5 |
| Denmark | 46.4 |
| Germany | 32.1 |
| Estonia | 33.3 |
| Ireland | 44.0 |
| Greece | 42.6 |
| Spain | 28.2 |
| France | 41.1 |
| Croatia | 36.4 |
| Italy | 14.8 |
| Cyprus | 39.9 |
| Latvia | 11.0 |
| Lithuania | 19.1 |
| Luxembourg | 52.9 |
| Hungary | 40.1 |
| Malta | 27.1 |
| Netherlands | 40.9 |
| Austria | 26.6 |
| Poland | 13.0 |
| Portugal | 12.3 |
| Romania | 32.5 |
| Slovenia | 31.7 |
| Slovakia | 53.0 |
| Finland | 53.7 |
| Sweden | 55.4 |
| EU-27 | 30.8 |